A/B Testing: The Science of Not Fooling Yourself
(Free Edition) Why most results are wrong — and how A/B testing gets us closer to the truth.
Welcome to NEW ECONOMIES, where we decode the technology trends reshaping industries and creating new markets. Whether you’re a founder building the future, an operator scaling innovation, or an investor spotting opportunities, we deliver the insights that matter before they become obvious. Subscribe to stay ahead of what’s next alongside 75,000+ others.
P.S. When you become an annual paid subscriber, you automatically access these best-in-class AI tools for free — for 12 months. Save thousands of dollars now!!
This week’s guest post:
Ron (Ronny) Kohavi is a consultant, educator, and former Vice President and Technical Fellow at Airbnb. Before that, he was a Microsoft Technical Fellow and Corporate VP in the Cloud and AI group, where he led the Experimentation Platform team. He previously led data mining and personalization at Amazon and served as VP of Business Intelligence at Blue Martini Software.
Ron holds a Ph.D. in Machine Learning from Stanford and is co-author of Trustworthy Online Controlled Experiments: A Practical Guide to A/B Testing, which is available in six languages. His research has been cited over 65,000 times.
Ronny also teaches the #1 course on A/B Testing on Maven, with a rating of 4.8/5.0. The interactive online course, which includes five 2-hour sessions, is available to NEW ECONOMIES readers with an exclusive 10% discount here!
Inside this week’s edition
This week’s edition dives into A/B Testing: The Science of Not Fooling Yourself, a masterclass in how to separate real causal impact from noise and illusion.
Inside this edition, you will learn:
Why most reported results are wrong — and how replication exposes hidden biases.
How to judge evidence quality using the Hierarchy of Evidence and avoid overtrusting observational studies.
The hidden math behind sample sizes and statistical power — and why detecting small effects demands huge datasets.
How to interpret p-values correctly (and why significance ≠ truth).
The art of skepticism — why extraordinary results require extraordinary proof.
By the end, you’ll not only understand what makes an experiment trustworthy — you’ll think twice before believing the next viral “study” or too-good-to-be-true growth hack.
Let’s dive in 🚀
If you’re developing software and have sufficient traffic, then there is no better mechanism to evaluate ideas than A/B testing. A/B tests, or online randomized controlled experiments, are the gold standard in science for establishing causality: the change you made caused the metrics to change.
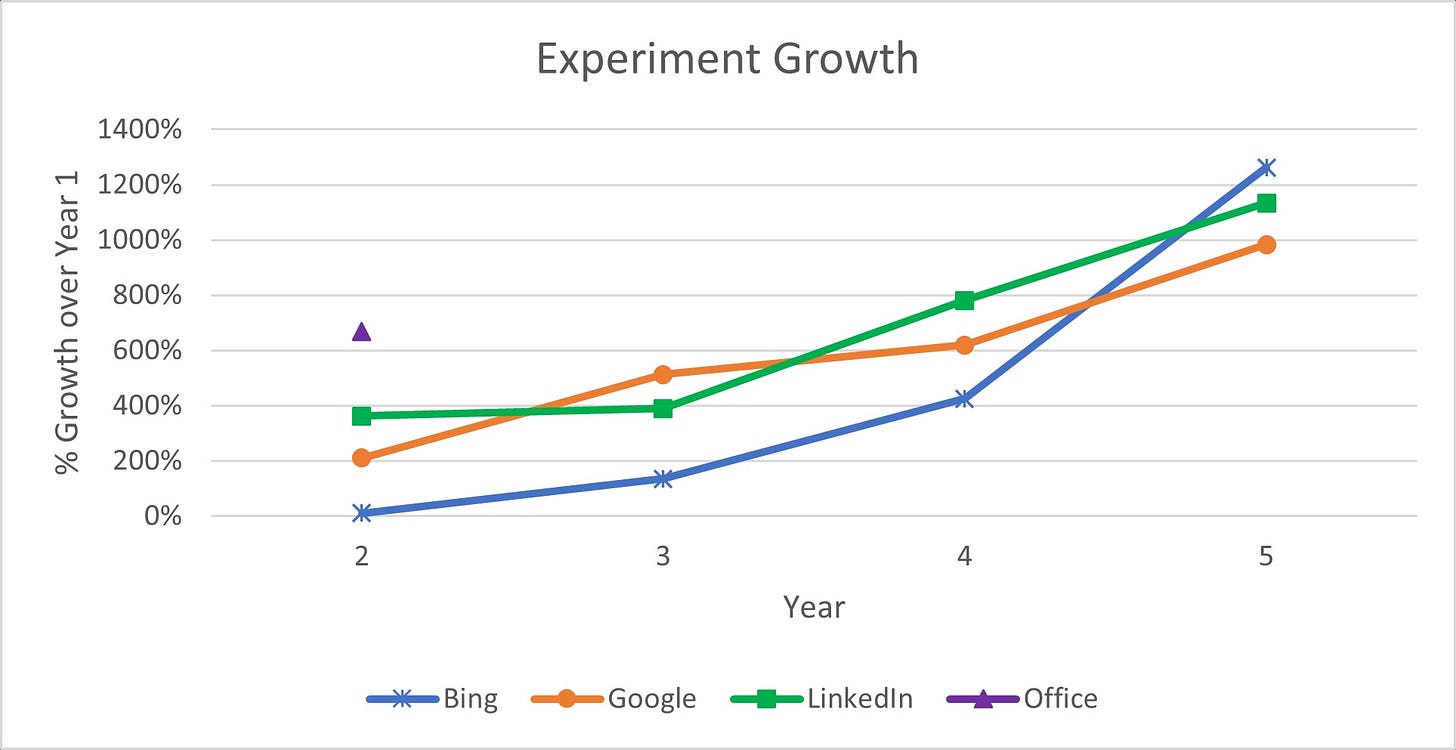
Several years ago, the top data-driven companies got together to look at challenges, including Airbnb, Amazon, Booking, Facebook, Google, LinkedIn, Lyft, Microsoft, Netflix, Stanford, Twitter (now X), Uber, Yandex (summit). Usage continues to grow, and Microsoft recently reported over 100K experiments are being run annually: every day hundreds of experiments are being started at Microsoft, and decisions are data-driven. What makes this so critical is that the data show that most experiments fail to improve the metrics they were designed to improve (data below).
Every change, whether to the UI (user interface), to the backend algorithms, to the machine learning models, should be evaluated using A/B tests because the data show that we are so often wrong about the value of our ideas. There are many examples in Chapter 1 of Trustworthy Online Controlled Experiments, at GoodUI, and Evidoo.
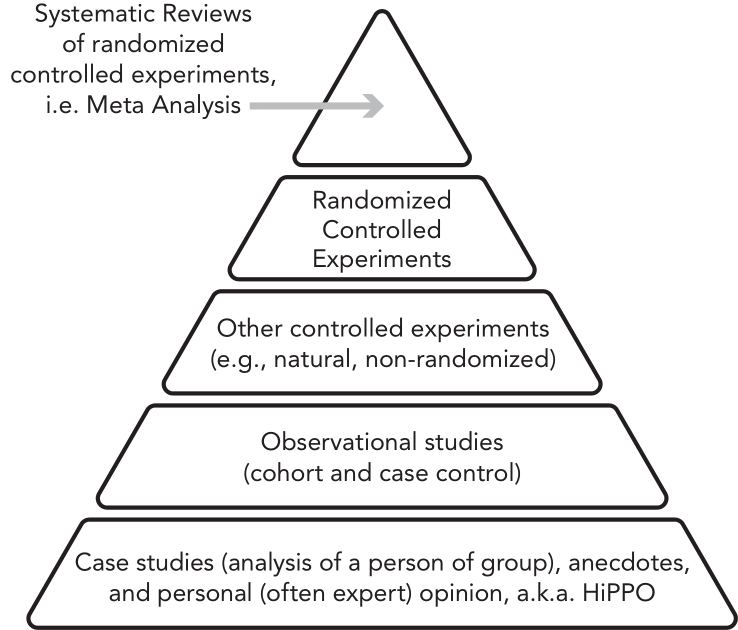
Studies are not created equal. When seeing a report or an article, it is important to use the Hierarchy of Evidence, shown below, to assess the reliability and trust that we assign to results. At the top are multiple randomized controlled experiments (not just a single experiment, but replications). As you go down the hierarchy, the trust level decreases. For example, observational studies are offline studies that look at historical data, but you cannot claim causality from observational studies.
There are many examples where observational studies overestimated effects or were even directionally incorrect. Young and Karr (article), for example, looked at 52 claims made in medical observational studies (second level above) that had follow-on randomized controlled trials/experiments (fourth level above) that followed. Zero (!) claims replicated and five were statistically significant in the opposite direction. Their summary they wrote (a bit hyperbolic, I admit) was: “Any claim coming from an observational study is most likely to be wrong.”
One of my favorite examples of overestimating effects in observational studies is a large study on display ads (article). The observational study with 50 million users at Yahoo! showed that the lift from display ads to users searching using keywords related to the brand shown is about 1,200%. After adjusting for confounders, the estimate was reduced to 871% (+/- 10%). The A/B test that followed showed that the effect is only 5.4%—that’s the trustworthy number, and the one we should be using to estimate the ROI of display ads.
Lesson 1
Always ask yourself: Where does this claim sit in the hierarchy? Assign low trust to case studies and observational studies; the trust increases with randomized controlled experiments and replications of these.
Even randomized controlled experiments are not as trustworthy as many think. A peer-reviewed publication, such as a paper that appeared in a prestigious journal, with a randomized controlled experiment and statistically significant results is likely to be false with higher probability than we think. One of the most cited papers by Ioannidis is “Why most published research findings are false” (with over 14,000 citations). It turns out that many such publications are false due to two key factors:
The (prior) probability that our experiment will be successful is low in many domains. In A/B testing, that is, online experiments, estimates are that the median success rate for experiments is about 10%, ranging from 8% to 33% (Table 2 in article).
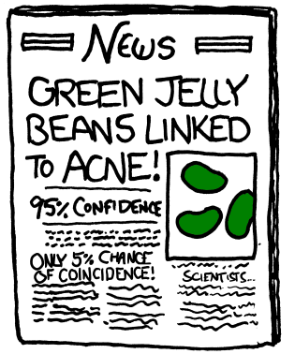
Multiple testing, or the Jellybean problem, shown nicely by XKCD. If there is no causal relationship, and you test multiple times, you dramatically increase the probability of a false positive. Check if one of 20 different colors of jellybeans causes acne, and there’s a good chance that one of 20 will be statistically significantly positive with p-value < 0.05 (the industry standard for statistical significance). This is what happens with academic publishing: people try many hypotheses; those that fail, go into the file drawer (paper); those that are statistically significant, get accepted for publication.
Lesson 2
Classical statistical significance (p-value < 0.05) in A/B tests does NOT imply that B is better than A with 95% probability. That depends on the success rate in the domain. With a median success rate of 10% in A/B tests, the probability that a statistically significant result is a true positive is only 78%. (See FPR in A/B Testing Intuition Busters Table 2.)
When running controlled experiments, the power formula tells us the minimum sample size we need for a desired minimum detectable effect (MDE). Detecting large effects, such as in a randomized controlled trial/experiment for a COVID vaccine that we want to reduce deaths by 50%, can be done with a sample of a few thousand people. What is often surprising to people is how quickly the required sample size grows with our desire to detect smaller effects. For example, a website that converts at 5% and wants to detect a 5% improvement to conversion requires over 240,000 users in the A/B test for proper power (talk slides 16-17). Detecting a 1% improvement to conversion requires not just five times more users, but 5^2=25 times more users, or over 6 million users in the A/B test.
Lesson 3
For e-commerce scenarios, you typically need over 240,000 users to run trustworthy A/B tests. Use the power formula and plug in a minimum relative effect of less than 5%. Once you have sufficient users, the magic starts, and you can run hundreds of concurrent A/B tests and become a data-driven organization. If you have fewer users, look at the big players and use their best practices, or learn from GoodUI, and Evidoo.
Twyman’s law states that “Any figure that looks interesting or different is usually wrong.” If a result looks too good to be true, treat it as a starting point for scrutiny, avoid the early celebration. Healthy skepticism is critically important. Nobel Prize winner Daniel Kahneman said in a 2023 interview: “When I see a surprising finding, my default is not to believe it. Twelve years ago, my default was to believe anything that was surprising.” His book, Thinking, Fast and Slow (2011), shares results from multiple studies that have not replicated, and that we today understand were false positives.
When you see a surprising result being reported, ask yourself whether it was sufficiently powered and ideally replicated. One of the key problems with low-power experiments is the Winner’s Curse: if you get a statistically significant result in a low-power experiment, the treatment effect is likely to be highly exaggerated (paper).
Here are two examples:
In 2010, a paper on a tiny experiment (n=42) reported that power posing (see image) elevates testosterone, lowers cortisol, increases tolerance for risk, and increases feelings of power. In 2012, a great—though, in hindsight, highly misleading—TED Talk went viral and became the second most viewed TED Talk for several years with tens of millions of plays. In 2015, a large replication failed to replicate three of four outcomes; only felt power replicated (a manipulation check). Multiple papers were written about this and by 2016 the lead author on the original paper wrote “The evidence against the existence of power poses is undeniable” and “I do not believe that ‘Power Pose’ effects are real.” Brandolini’s law applies here—the energy to debunk far exceeds the energy to make a claim. In the last year, nine years after it was agreed by most scholars to be a false positive, the TED Talk was played 2.1M times, or over 5,700 per day (full story).
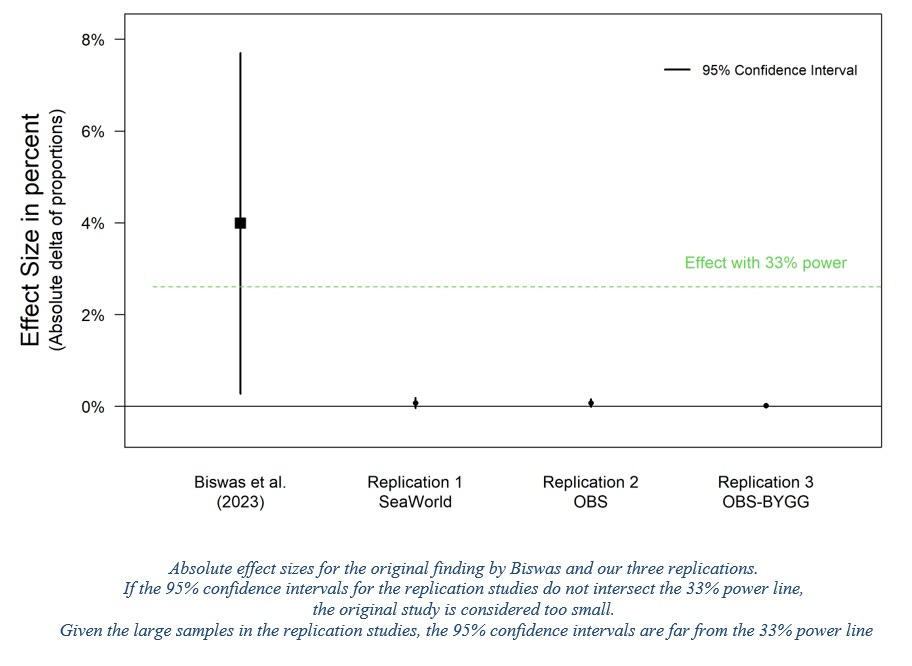
In 2024, a paper claimed that rounded buttons increase click-through rates relative to square buttons. An A/B test showed 55% lift to click-through rates, a striking finding with potentially wide-ranging implications for the digital industry that is seeking to enhance consumer engagement. The A/B test was based on only 919 visits. Three large replications were done with sample sizes 2,000 times larger (over 1.9M users in each), resulting in lift estimates of 0.16%, 0.29%, and 0.73%, all not even statistically significant (doc).
Lesson 4
Be skeptical about extreme results with high lifts, especially from small studies. Look for replications. Remember Carl Sagan’s statement: “Extraordinary claims require extraordinary evidence.”
Summary
Randomized online controlled experiments, or A/B tests, are the gold standard in science for establishing causality. While there are certainly issues with sample sizes, interpreting p-values, and other tests for validity, it is important to remember that no other approach is as trustworthy in the hierarchy of evidence. To paraphrase what Churchill said about democracy, A/B tests have so many pitfalls that it seems hard to establish causality with a high level of trust; controlled experiments must be the worst methodology, except for all the others that have been tried.
Join Ronny’s course: Accelerating Innovation with A/B Testing
Learn from a world-leading expert how to design and analyze trustworthy A/B tests to evaluate ideas, integrate AI/ML, and grow your business. NEW ECONOMIES readers can enjoy an exclusive 10% code on the program’s 2025 pricing ($1,999).
*Starting Dec 1st which includes five 2-hour sessions.
If you enjoyed this edition, help sustain our work by clicking ❤️ and 🔄 at the top of this post.




Beautiful article. I attribute most of my professional success to AB-testing
Learnt so much from this - thanks Ronny!